Two Sample Proportion Test with Minitab
What is the Two Sample Proportion Test?
The two sample proportion test is a hypothesis test to compare the proportions of one certain event occurring in two populations following the binomial distribution.
- Null Hypothesis(H0): p1 = p2
- Alternative Hypothesis(Ha): p1 ≠ p2
Two Sample Proportion Test Assumptions
- The sample data drawn from the populations of interest are unbiased and representative.
- There are only two possible outcomes in each trial for both populations: success/failure, yes/no, and defective/non-defective etc.
- The underlying distributions of both populations are binomial distribution.
- When np ≥ 5 and np(1 – p) ≥ 5, the binomial distribution can be approximated by the normal distribution.
How the Two Sample Proportion Test Works
When np ≥ 5 and np(1 – p) ≥ 5, we use normal distribution to approximate the underlying binomial distributions of the populations.
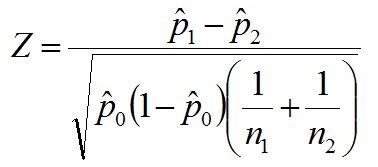
Test Statistic
Where:

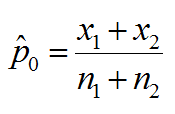
and where:

 and
and  are the observed proportions of events in the two samples
 and
and  is the number of trials in the two samples respectively
 and
and  is the number of events in the two samples respectively
When |Zcalc| is smaller than Zcrit, , we fail to reject the null hypothesis.
Use Minitab to Run a Two Sample Proportion Test
Case study: We are interested in comparing the exam pass rates of a high school in March and April using a nonparametric (i.e. distribution-free) hypothesis test: two sample proportion test.
Data File: “Two Sample Proportion” tab in “Sample Data.xlsx”
- Null Hypothesis(H0): pMarch = pApril
- Alternative Hypothesis(Ha): pMarch ≠ pApril
Steps to run a two sample proportion test in Minitab:
- Click Stat → Basic Statistics → 2 Proportions.
- A new window named “Two-SampleProportion” pops up.
- Click the drop-down menu and choose “Summarized data.”
- Enter “89” in the box intersecting “First” and “Events.”
- Enter “112” in the box intersecting “First” and “Trials.”
- Enter “102” in the box intersecting “Second” and “Events.”
- Enter “130” in the box intersecting “Second” and “Trials.”

- Click “OK.”
- The two-sample proportion test results appear in the session window.

Model summary: The p-value of the two-sample proportion test is 0.849, greater than the alpha level (0.05), and we fail to reject the null hypothesis. We conclude that the exam pass rates of the high school in March and April are not statistically different.
