Posts Tagged ‘Six Sigma’
Mann Whitney Testing with JMP
What is the Mann Whitney Test? The Mann Whitney test (also called Mann–Whitney U test or Wilcoxon rank-sum test) is a statistical hypothesis test to compare the medians of two populations that are not normally distributed. In a non-normal distribution, the median is the better representation of the center of the distribution. Null Hypothesis (H0): η1…
Read MoreXbar S Chart with SigmaXL
What is a Xbar S Chart? The X-S chart (also called Xbar S chart) is a control chart for continuous data with a constant subgroup size greater than ten. The Xbar chart plots the average of a subgroup as a data point. The S chart plots the standard deviation within a subgroup as a data…
Read MoreXbar S Chart with JMP
What is a Xbar S Chart? The X-S chart (also called Xbar S chart) is a control chart for continuous data with a constant subgroup size greater than ten. The Xbar chart plots the average of a subgroup as a data point. The S chart plots the standard deviation within a subgroup as a data…
Read MoreXbar S Chart with Minitab
What is a Xbar S Chart? The X-S chart (also called Xbar S chart) is a control chart for continuous data with a constant subgroup size greater than ten. The Xbar chart plots the average of a subgroup as a data point. The S chart plots the standard deviation within a subgroup as a data…
Read MoreNP Chart with SigmaXL
What is an NP Chart? The NP chart is a control chart monitoring the count of defectives. It plots the number of defectives in one subgroup as a data point. The subgroup size of the NP-chart is constant. The underlying distribution of this control chart is binomial distribution. NP Chart Equations NP-chart Data Point: Center…
Read MoreNP Chart with JMP
What is NP Chart? The NP chart is a control chart monitoring the count of defectives. It plots the number of defectives in one subgroup as a data point. The subgroup size of the NP-chart is constant. The underlying distribution of this control chart is binomial distribution. NP Chart Equations NP-chart Data Point: Center Line:…
Read MoreNP Chart with Minitab
What is a NP Chart? The NP chart is a control chart monitoring the count of defectives. It plots the number of defectives in one subgroup as a data point. The subgroup size of the NP-chart is constant. The underlying distribution of this control chart is binomial distribution. NP Chart Equations NP-chart Data Point: Center…
Read MoreCumSum Chart with JMP
What is a CumSum Chart? The CumSum chart (also called cumulative sum control chart or CUMSUM chart) is a control chart of monitoring the cumulative sum of the subgroup mean deviations from the process target. It detects the shift of the process mean from the process target over time. The underlying distribution of the CumSum…
Read MoreCumSum Chart with Minitab
What is a CumSum Chart? The CumSum chart (also called cumulative sum control chart or CUSUM chart) is a control chart of monitoring the cumulative sum of the subgroup mean deviations from the process target. It detects the shift of the process mean from the process target over time. The underlying distribution of the CuSum…
Read MoreEWMA Chart with JMP
What is EWMA Chart? The EWMA chart (Exponentially-Weighted Moving Average Chart) is a control chart monitoring the exponentially-weighted average of previous and present subgroup means. The more recent data get more weight than older data. It detects the shift of the process mean from the process target over time. The underlying distribution of the EWMA…
Read MoreEWMA Chart with Minitab
What is an EWMA Chart? The EWMA chart (Exponentially-Weighted Moving Average Chart) is a control chart monitoring the exponentially-weighted average of previous and present subgroup means. The more recent data get more weight than older data. It detects the shift of the process mean from the process target over time. The underlying distribution of the…
Read MorePaired t Test with Minitab
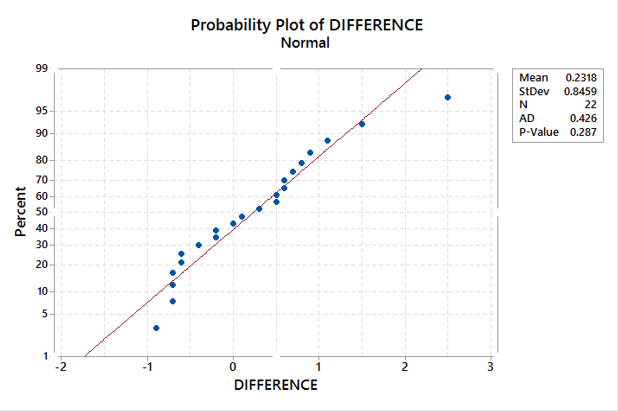
What is a Paired t Test? A Third type of a Two Sample t-Test is the Paired t Test. This test is used when the two populations are dependent of each other, so each data point from one distribution corresponds to a data point in the other distribution. When using a paired t test, the…
Read MoreCentral Limit Theorem with Minitab
What is Central Limit Theorem? The Central Limit Theorem is one of the fundamental theorems of probability theory. It states a condition under which the mean of a large number of independent and identically-distributed random variables, each of which has a finite mean and variance, would be approximately normally distributed. Let us assume Y1, Y2…
Read MoreMulti Vari Analysis with Minitab
What is Multi Vari Analysis? Multi Vari analysis is a graphic-driven method to analyze the effects of categorical inputs on a continuous output. It studies how the variation in the output changes across different inputs and helps us quantitatively determine the major source of variability in the output. Multi-Vari charts are used to visualize the…
Read MorePareto Analysis with Minitab
What is the Pareto Principle? The Pareto principle is an observation not a law. Named after Italian economist Vilfredo Pareto, this principle states that for a variety of situations, 80% of consequences come from 20% of the causes, thus the Pareto principle is also known as the 80/20 rule. The 80/20 rule basically reminds us that…
Read MoreVariable Gage R&R with Minitab
What is Variable Gage R&R? Whenever something is measured repeatedly or by different people or processes, the results of the measurements will vary. Variation comes from two primary sources: Differences between the parts being measured The measurement system We can use a variable Gage R&R to conduct a measurement system analysis to determine what portion…
Read MoreOne Sample t Test with SigmaXL
What is a One Sample t Test? A One sample t test is a hypothesis test to study whether there is a statistically significant difference between a population mean and a specified value. Null Hypothesis (H0): μ = μ0 Alternative Hypothesis (Ha): μ ≠ μ0 Where: μ is the mean of a population of our…
Read MoreCentral Limit Theorem with SigmaXL
Central Limit Theorem The Central Limit Theorem is one of the fundamental theorems of probability theory. It states a condition under which the mean of a large number of independent and identically-distributed random variables, each of which has a finite mean and variance, would be approximately normally distributed. Let us assume Y1, Y2 . .…
Read MoreRun Chart with SigmaXL
Why we use a Run Chart A run chart is a chart used to present data in time order. These charts capture process performance over time. The X axis indicates time and the Y axis shows the observed values. A run chart is similar to a scatter plot in that it shows the relationship between X and…
Read MoreMulti Vari Analysis with SigmaXL
Multi-Vari Analysis Multi Vari Analysis is a graphic-driven method to analyze the effects of categorical inputs on a continuous output. It studies how the variation in the output changes across different inputs and helps us quantitatively determine the major source of variability in the output. Multi Vari charts are used to visualize the source of…
Read More