Posts Tagged ‘JMP’
IR Chart with JMP
IR Chart The IR chart (also called individual-moving range chart or I-MR chart) is a popular control chart for continuous data with subgroup size equal to one. The I chart plots an individual observation as a data point. The MR chart plots the absolute value of the difference between two consecutive observations in individual charts…
Read MoreMedian Test with JMP
What is Moods Median Test? Mood’s median test is a statistical test to compare the medians of two or more populations. Null Hypothesis (H0): η1 = … = ηk Alternative Hypothesis (Ha): At least one of the medians is different from the others The symbol k is the number of groups of our interest and…
Read MoreKruskal Wallis Test with JMP
What is Kruskal–Wallis One-Way Analysis of Variance? The Kruskal Wallis one-way analysis of variance is a statistical hypothesis test to compare the medians among more than two groups. Null Hypothesis (H0): η1 = η2 = … = ηk Alternative Hypothesis (Ha): at least one of the medians is different from others. Where: ni is the…
Read MoreRun Chart with JMP
What is a Run Chart? A run chart is a chart used to present data in time order. Run charts capture process performance over time. The X axis of a run chart indicates time and the Y axis shows the observed values. A run chart is similar to a scatter plot in that it shows…
Read MoreXbar R Chart with JMP
Xbar R Chart The Xbar R chart is a control chart for continuous data with a constant subgroup size between two and ten. The Xbar chart plots the average of a subgroup as a data point. The R chart plots the difference between the highest and lowest values within a subgroup as a data point.…
Read MoreOne Sample Wilcoxon Test with JMP
What is the One Sample Wilcoxon Test? The one sample Wilcoxon test is a hypothesis test to compare the median of one population with a specified value. Null Hypothesis (H0): η = η0 Alternative Hypothesis (Ha): η ≠ η0 It is an alternative test of one sample t-test when the distribution of the data is non-normal. It is…
Read MoreOne Sample Proportion Test with JMP
What is the One Sample Proportion Test? One sample proportion test is a hypothesis test to compare the proportion of one certain outcome (e.g. the number of successes per the number of trials, or the number of defects per the total number of opportunities) occurring in a population following the binomial distribution with a specified…
Read MoreTwo Sample t Test with JMP
What is Two Sample t Test? Two sample t test is a hypothesis test to study whether there is a statistically significant difference between the means of two populations. Null Hypothesis (H0): μ1 = μ2 Alternative Hypothesis Ha) : μ1 ≠ μ2 Where: μ1 is the mean of one population and μ2 is the mean of…
Read MorePaired t Test with JMP
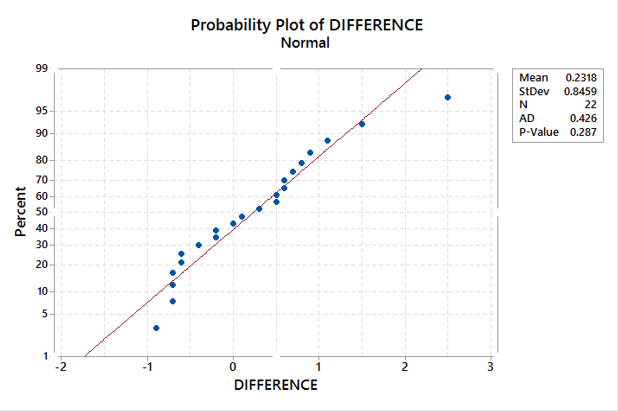
What is the Paired t Test? A Third type of a Two Sample t-Test is the Paired t Test. This test is used when the two populations are dependent of each other, so each data point from one distribution corresponds to a data point in the other distribution. When using a paired t test, the…
Read MoreOne Way ANOVA with JMP
What is One Way ANOVA? One way ANOVA is a statistical method to compare means of two or more populations. Null Hypothesis(H0):): μ1 = μ2 …= μk Alternative Hypothesis(Ha): At least one μi is different, where i is any value from 1 to k It is a generalized form of the two sample t-test since…
Read MoreScatter Plot with JMP
What is a Scatter Plot? A scatter plot is a diagram to present the relationship between two variables of a data set. A scatterplot consists of a set of data points. On the scatterplot, a single observation is presented by a data point with its horizontal position equal to the value of one variable and…
Read MoreMann Whitney Testing with JMP
What is the Mann Whitney Test? The Mann Whitney test (also called Mann–Whitney U test or Wilcoxon rank-sum test) is a statistical hypothesis test to compare the medians of two populations that are not normally distributed. In a non-normal distribution, the median is the better representation of the center of the distribution. Null Hypothesis (H0): η1…
Read MoreXbar S Chart with JMP
What is a Xbar S Chart? The X-S chart (also called Xbar S chart) is a control chart for continuous data with a constant subgroup size greater than ten. The Xbar chart plots the average of a subgroup as a data point. The S chart plots the standard deviation within a subgroup as a data…
Read MoreNP Chart with JMP
What is NP Chart? The NP chart is a control chart monitoring the count of defectives. It plots the number of defectives in one subgroup as a data point. The subgroup size of the NP-chart is constant. The underlying distribution of this control chart is binomial distribution. NP Chart Equations NP-chart Data Point: Center Line:…
Read MoreCumSum Chart with JMP
What is a CumSum Chart? The CumSum chart (also called cumulative sum control chart or CUMSUM chart) is a control chart of monitoring the cumulative sum of the subgroup mean deviations from the process target. It detects the shift of the process mean from the process target over time. The underlying distribution of the CumSum…
Read MoreEWMA Chart with JMP
What is EWMA Chart? The EWMA chart (Exponentially-Weighted Moving Average Chart) is a control chart monitoring the exponentially-weighted average of previous and present subgroup means. The more recent data get more weight than older data. It detects the shift of the process mean from the process target over time. The underlying distribution of the EWMA…
Read MoreVariable Gage R&R with Minitab
What is Variable Gage R&R? Whenever something is measured repeatedly or by different people or processes, the results of the measurements will vary. Variation comes from two primary sources: Differences between the parts being measured The measurement system We can use a variable Gage R&R to conduct a measurement system analysis to determine what portion…
Read More