Posts Tagged ‘Analyze Phase’
Two Sample Proportion Test with SigmaXL
What is the Two Sample Proportion Test? The two sample proportion test is a hypothesis test to compare the proportions of one certain event occurring in two populations following the binomial distribution. Null Hypothesis(H0): p1 = p2 Alternative Hypothesis(Ha): p1 ≠ p2 Two Sample Proportion Test Assumptions The sample data drawn from the populations of…
Read MoreTwo Sample Proportion Test with JMP
What is the Two Sample Proportion Test? The two sample proportion test is a hypothesis test to compare the proportions of one certain event occurring in two populations following the binomial distribution. Null Hypothesis(H0): p1 = p2 Alternative Hypothesis(Ha): p1 ≠ p2 Two Sample Proportion Test Assumptions The sample data drawn from the populations of…
Read MoreTwo Sample Proportion Test with Minitab
What is the Two Sample Proportion Test? The two sample proportion test is a hypothesis test to compare the proportions of one certain event occurring in two populations following the binomial distribution. Null Hypothesis(H0): p1 = p2 Alternative Hypothesis(Ha): p1 ≠ p2 Two Sample Proportion Test Assumptions The sample data drawn from the populations of…
Read MoreOne Sample t Test with JMP
One Sample t Test What is a t Test? In statistics, a t test is a hypothesis test in which the test statistic follows a Student’s t distribution if the null hypothesis is true. We apply a one sample t test when the population variance (σ) is unknown and we use the sample standard deviation…
Read MoreCentral Limit Theorem with JMP
What is Central Limit Theorem? The Central Limit Theorem is one of the fundamental theorems of probability theory. It states a condition under which the mean of a large number of independent and identically-distributed random variables, each of which has a finite mean and variance, would be approximately normally distributed. Let us assume Y1, Y2…
Read MoreMulti Vari Analysis with JMP
What is Multi-Vari Analysis? Multi-vari analysis is a graphic-driven method to analyze the effects of categorical inputs on a continuous output. It studies how the variation in the output changes across different inputs and helps us quantitatively determine the major source of variability in the output. Multi-vari charts are used to visualize the source of…
Read MoreChi Square Test with SigmaXL
Chi Square (Contingency Tables) We have looked at hypothesis tests to analyze the proportion of one population vs. a specified value, and the proportions of two populations, but what do we do if we want to analyze more than two populations? A chi-square test is a hypothesis test in which the sampling distribution of the…
Read MoreChi Square Test with JMP
Chi Square (Contingency Tables) We have looked at hypothesis tests to analyze the proportion of one population vs. a specified value, and the proportions of two populations, but what do we do if we want to analyze more than two populations? A chi-square test is a hypothesis test in which the sampling distribution of the…
Read MoreChi Square Test with Minitab
Chi Square (Contingency Tables) We have looked at hypothesis tests to analyze the proportion of one population vs. a specified value, and the proportions of two populations, but what do we do if we want to analyze more than two populations? A chi-square test is a hypothesis test in which the sampling distribution of the…
Read MoreMedian Test with JMP
What is Moods Median Test? Mood’s median test is a statistical test to compare the medians of two or more populations. Null Hypothesis (H0): η1 = … = ηk Alternative Hypothesis (Ha): At least one of the medians is different from the others The symbol k is the number of groups of our interest and…
Read MoreKruskal Wallis Test with JMP
What is Kruskal–Wallis One-Way Analysis of Variance? The Kruskal Wallis one-way analysis of variance is a statistical hypothesis test to compare the medians among more than two groups. Null Hypothesis (H0): η1 = η2 = … = ηk Alternative Hypothesis (Ha): at least one of the medians is different from others. Where: ni is the…
Read MoreOne Sample Wilcoxon Test with SigmaXL
What is the One Sample Wilcoxon Test? The one sample Wilcoxon test is a hypothesis test to compare the median of one population with a specified value. Null Hypothesis (H0): η = η0 Alternative Hypothesis (Ha): η ≠ η0 It is an alternative test of one sample t-test when the distribution of the data is non-normal. It is…
Read MoreOne Sample Wilcoxon Test with JMP
What is the One Sample Wilcoxon Test? The one sample Wilcoxon test is a hypothesis test to compare the median of one population with a specified value. Null Hypothesis (H0): η = η0 Alternative Hypothesis (Ha): η ≠ η0 It is an alternative test of one sample t-test when the distribution of the data is non-normal. It is…
Read MoreOne Sample Proportion Test with SigmaXL
What is the One Sample Proportion Test? One sample proportion test is a hypothesis test to compare the proportion of one certain outcome (e.g. the number of successes per the number of trials, or the number of defects per the total number of opportunities) occurring in a population following the binomial distribution with a specified…
Read MoreOne Sample Proportion Test with JMP
What is the One Sample Proportion Test? One sample proportion test is a hypothesis test to compare the proportion of one certain outcome (e.g. the number of successes per the number of trials, or the number of defects per the total number of opportunities) occurring in a population following the binomial distribution with a specified…
Read MoreTwo Sample t Test with JMP
What is Two Sample t Test? Two sample t test is a hypothesis test to study whether there is a statistically significant difference between the means of two populations. Null Hypothesis (H0): μ1 = μ2 Alternative Hypothesis Ha) : μ1 ≠ μ2 Where: μ1 is the mean of one population and μ2 is the mean of…
Read MorePaired t Test with JMP
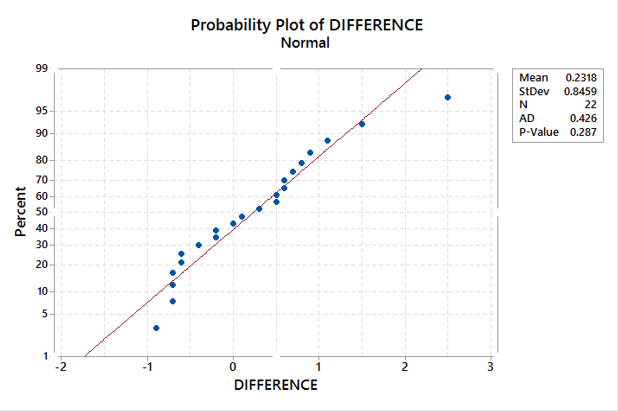
What is the Paired t Test? A Third type of a Two Sample t-Test is the Paired t Test. This test is used when the two populations are dependent of each other, so each data point from one distribution corresponds to a data point in the other distribution. When using a paired t test, the…
Read MoreOne Way ANOVA with JMP
What is One Way ANOVA? One way ANOVA is a statistical method to compare means of two or more populations. Null Hypothesis(H0):): μ1 = μ2 …= μk Alternative Hypothesis(Ha): At least one μi is different, where i is any value from 1 to k It is a generalized form of the two sample t-test since…
Read MoreMann Whitney Testing with JMP
What is the Mann Whitney Test? The Mann Whitney test (also called Mann–Whitney U test or Wilcoxon rank-sum test) is a statistical hypothesis test to compare the medians of two populations that are not normally distributed. In a non-normal distribution, the median is the better representation of the center of the distribution. Null Hypothesis (H0): η1…
Read MoreCentral Limit Theorem with Minitab
What is Central Limit Theorem? The Central Limit Theorem is one of the fundamental theorems of probability theory. It states a condition under which the mean of a large number of independent and identically-distributed random variables, each of which has a finite mean and variance, would be approximately normally distributed. Let us assume Y1, Y2…
Read More