Mann Whitney Testing with JMP
What is the Mann Whitney Test?
The Mann Whitney test (also called Mann–Whitney U test or Wilcoxon rank-sum test) is a statistical hypothesis test to compare the medians of two populations that are not normally distributed. In a non-normal distribution, the median is the better representation of the center of the distribution.
- Null Hypothesis (H0): η1 = η2
- Alternative Hypothesis (Ha): η1 ≠ η2
Where:
- η1 is the median of one population
- η2 is the median of the other population
- The null hypothesis is that the medians are equal, and the alternative is that they are not equal
Mann Whitney Test Assumptions
- The sample data drawn from the populations of interest are unbiased and representative
- The data of both populations are continuous or ordinal when the spacing between adjacent values is not constant (Reminder: Ordinal data—A set of data is said to be ordinal if the values can be ranked or have a rating scale attached. You can count and order, but not measure, ordinal data)
- The two populations are independent to each other
- The Mann–Whitney test is robust for the non-normally distributed population
- The Mann–Whitney test can be used when shapes of the two populations’ distributions are different
How Mann Whitney Test Works
Step 1:
Group the two samples from two populations (sample 1 is from population 1 and sample 2 is from population 2) into a single data set and then sort the data in ascending order ranked from 1 to n, where n is the total number of observations.
Step 2:
Add up the ranks for all the observations from sample 1 and call it R1. Add up the ranks for all the observations from sample 2 and call it R2 .
Step 3:
Calculate the test statistics
![]()
Where:
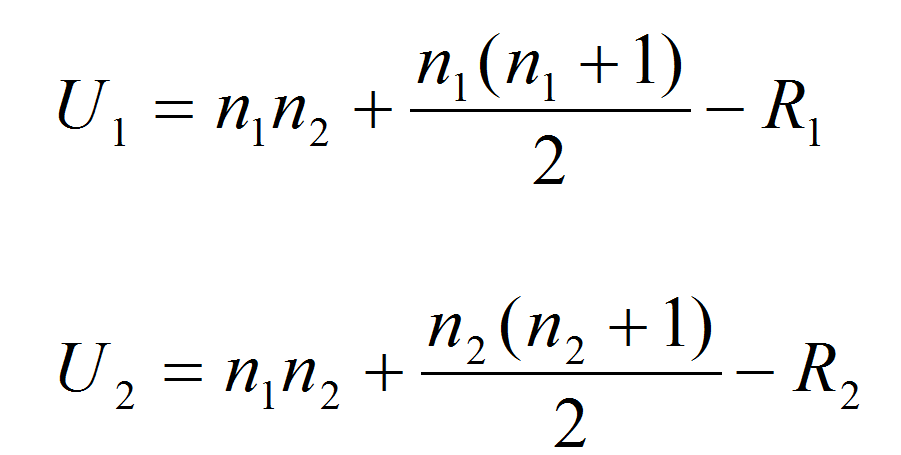
and where:
- η1 and η2 are the sample sizes
- R1 and R2 are the sum of ranks for observations from sample 1 and 2 respectively
Step 4:
Make a decision on whether to reject the null hypothesis
- Null Hypothesis (H0): η1 = η2
- Alternative Hypothesis (Ha): η1 ≠ η2
If both of the sample sizes are smaller than 10, the distribution of U under the null hypothesis is tabulated.
- The test statistic is U and, by using the Mann–Whitney table, we would find the p-value
- If the p-value is smaller than alpha level (0.05), we reject the null hypothesis
- If the p-value is greater than alpha level (0.05), we fail to reject the null hypothesis
- If both sample sizes are greater than 10, the distribution of U can be approximated by a normal distribution. In other words, (U-μ)/σ follows a standard normal distribution
![]()
Where:
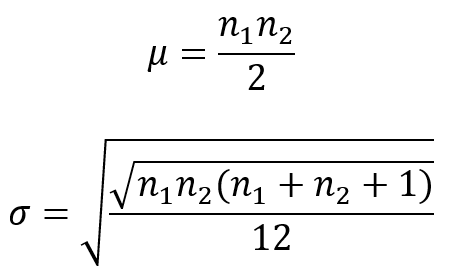
If the sample sizes are greater than 10, then the distribution of U can be approximated by a normal distribution. The U value is then plugged into the formula seen here to calculate a Z statistic.
When |Zcalc| is greater than Z value at α/2 level (e.g. when α = 5%, the z value we compare |Zcalc| to is 1.96), we reject the null hypothesis.
Use JMP to Run a Mann–Whitney Test
Case study: We are interested in comparing customer satisfaction between two types of customers using a nonparametric (i.e. distribution-free) hypothesis test: Mann–Whitney test.
Data File: “Mann–Whitney.jmp”
 Fig 1.0 Mann-Whitney Test
- Null Hypothesis (H0): η1 = η2
- Alternative Hypothesis (Ha): η1 ≠ η2
Steps to run a Mann–Whitney Test in JMP:
- Click Analyze -> Fit Y by X
- Select “Overall Satisfaction” as “Y, Response”
- Select “Customer Type” as “X, Factor”

- Click “OK”
- Click on the red triangle button next to “One-Way Analysis of Overall Satisfaction by Customer Type”
- Click Nonparametric -> Wilcoxon Test

Model summary: The p-value of the test is lower than alpha level (0.05); so we reject the null hypothesis and conclude that there is a statistically significant difference between the overall satisfaction medians of the two customer types.
The result of the test is boxed in: The p-value is lower than the alpha value of 0.05; therefore, we must reject the null hypothesis and claim that there is a significant difference between the median customer satisfaction levels of the two groups.