Lean Six Sigma Forum
Sigma levels
Quote from Jeanette Redstone on January 16, 2019, 3:43 pmHi,I'm just working through the first training unit: Overview of Six Sigma BB. On the page about the Sigma Level, it shows a process distribution curve with LSL 1 std dev below mean and USL 1 std dev above the mean. Then the box to the right says that "Approximately 70% of the products are defective!".±1 std dev of the mean should contain about 68% of the samples... so shouldn't approx 70% be good, and the remaining 32% (only) be defective? Or am I missing something?Thanks.
Quote from Michael Parker on January 16, 2019, 5:43 pmJeanette,
Thanks for the question, it's certainly one that gets asked often and in various ways too...Sooo!, to Jeanette and everyone else with a brain of their own who are curious about something... Through their work they have learned that the empirical rule indicates that approximately 68% of the data will fall between -1 and +1 standard deviations of the mean in a normal distribution.
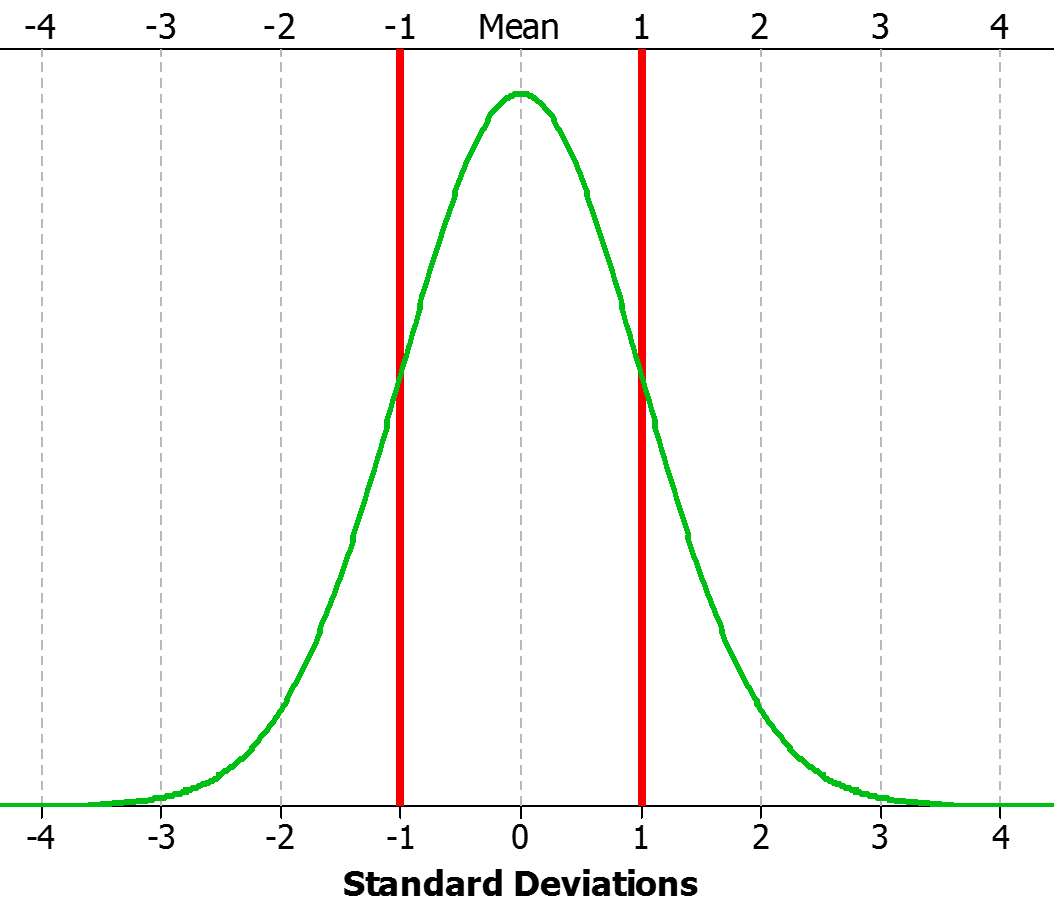
Ok, that's great! so that means a 1 sigma process (one with the LSL at -1 standard deviations from the mean and the USL at +1 standard deviations from the mean) should have about a 32% defect rate..right? where 68% of the data is between the specification limits and the rest (32%) are outside the spec limits. Sort of like the picture below:
Makes sense right? I agree...makes sense to me too! But, unfortunately, it's not true.
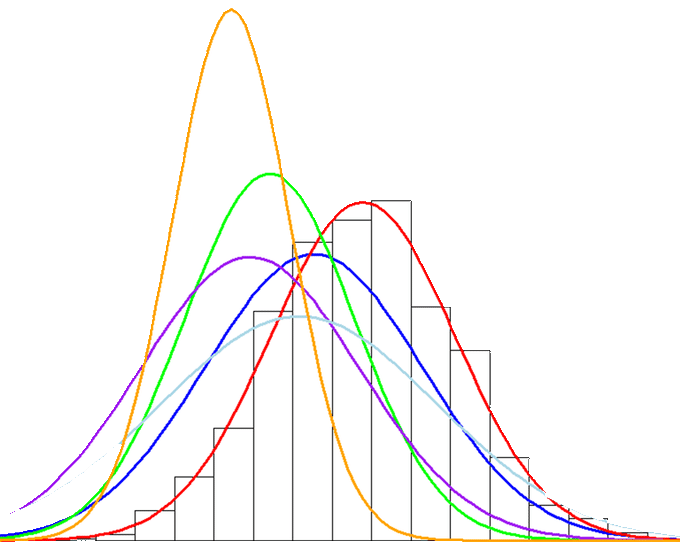
A one (1) sigma level process has a defect rate of 69.76%. You see, in order to explain what we don't understand, we have to refer to this old and arbitrary industry standard called the 1.5 sigma shift. What the engineers at Motorola observed when studying their own process performance data was that over time, their distribution of interest might maintain similar measurement characteristics (range, stdev, min, max, median, mode etc) but the distribution would "shift" or "drift" over time, kinda like the image below.
So, Motorola's process performance distributions shift or drift over time...what's that mean? Well, they concluded that in live operations, they should expect to see an actual defect rate equivalent to about 1.5 sigma levels worse that the sigma level estimated from their initial, single, and static process performance distribution. Therefore they determined that they would apply a 1.5 sigma shift to all DPMO Sigma Level estimates.
You can try it yourself in excel...in the Six Sigma world, 6 Sigma equals 3.4 defects per million opportunities. That's 3.4/1,000,000 for a defect rate of 0.00034%. Enter this equation in excel =NORMSINV(1-0.0000034)
What did you get in return??
You should have gotten 4.4998 or 4.5 which is 1.5 less that the assumed sigma level of 6 for the DPMO of 3.4.
You don't have to agree with this "shift" theory. In truth I largely disregard it. To me, it is entirely irrelevant and detracts from the true value of Six Sigma's D.M.A.I.C. methodology. Please don't spend any more time than you already have trying to rationalize it. Instead, focus on learning how to define problems, eliminate potential 'x' variables and identify and validate the critical ones. Then fix, improve, and refine processes...that's why I hope you're here, that's what is going to make a difference in your work performance and your career.
Jeanette,
Thanks for the question, it's certainly one that gets asked often and in various ways too...Sooo!, to Jeanette and everyone else with a brain of their own who are curious about something... Through their work they have learned that the empirical rule indicates that approximately 68% of the data will fall between -1 and +1 standard deviations of the mean in a normal distribution.

Ok, that's great! so that means a 1 sigma process (one with the LSL at -1 standard deviations from the mean and the USL at +1 standard deviations from the mean) should have about a 32% defect rate..right? where 68% of the data is between the specification limits and the rest (32%) are outside the spec limits. Sort of like the picture below:
Makes sense right? I agree...makes sense to me too! But, unfortunately, it's not true.
A one (1) sigma level process has a defect rate of 69.76%. You see, in order to explain what we don't understand, we have to refer to this old and arbitrary industry standard called the 1.5 sigma shift. What the engineers at Motorola observed when studying their own process performance data was that over time, their distribution of interest might maintain similar measurement characteristics (range, stdev, min, max, median, mode etc) but the distribution would "shift" or "drift" over time, kinda like the image below.
So, Motorola's process performance distributions shift or drift over time...what's that mean? Well, they concluded that in live operations, they should expect to see an actual defect rate equivalent to about 1.5 sigma levels worse that the sigma level estimated from their initial, single, and static process performance distribution. Therefore they determined that they would apply a 1.5 sigma shift to all DPMO Sigma Level estimates.
You can try it yourself in excel...in the Six Sigma world, 6 Sigma equals 3.4 defects per million opportunities. That's 3.4/1,000,000 for a defect rate of 0.00034%. Enter this equation in excel =NORMSINV(1-0.0000034)
What did you get in return??
You should have gotten 4.4998 or 4.5 which is 1.5 less that the assumed sigma level of 6 for the DPMO of 3.4.
You don't have to agree with this "shift" theory. In truth I largely disregard it. To me, it is entirely irrelevant and detracts from the true value of Six Sigma's D.M.A.I.C. methodology. Please don't spend any more time than you already have trying to rationalize it. Instead, focus on learning how to define problems, eliminate potential 'x' variables and identify and validate the critical ones. Then fix, improve, and refine processes...that's why I hope you're here, that's what is going to make a difference in your work performance and your career.
Quote from Jeanette Redstone on January 17, 2019, 2:34 pmOk, that clears that up. So, the 6σ DPMO is calculated from what would be expected at 4.5σ from the mean on a normal distribution curve.
Now, I understand the concept, but I have another quick question to help me understand the mechanics of it before I move on:
If you apply a 1.5σ shift to the various σ levels, how does that look for the lower levels?
- At 6σ level, you use standard stats at 6 - 1.5 = 4.5σ to calculate DPMO etc
- At 5σ, use 3.5
- At 4σ, use 2.5
- At 3σ, use 1.5
- At 2σ, use ???
- At 1σ, use ???
Thanks!
Ok, that clears that up. So, the 6σ DPMO is calculated from what would be expected at 4.5σ from the mean on a normal distribution curve.
Now, I understand the concept, but I have another quick question to help me understand the mechanics of it before I move on:
If you apply a 1.5σ shift to the various σ levels, how does that look for the lower levels?
- At 6σ level, you use standard stats at 6 - 1.5 = 4.5σ to calculate DPMO etc
- At 5σ, use 3.5
- At 4σ, use 2.5
- At 3σ, use 1.5
- At 2σ, use ???
- At 1σ, use ???
Thanks!
Quote from Michael Parker on January 28, 2019, 5:52 pmJeanette - see this DPMO-Sigma Level Table: https://lsc.studysixsigma.com/content/lsc/templates/DPMO_Sigma_Level.xlsx
Jeanette - see this DPMO-Sigma Level Table: https://lsc.studysixsigma.com/content/lsc/templates/DPMO_Sigma_Level.xlsx